About Contour Plot for Excel
Real contour plots are created in Excel. You can interact with the contour plot just like any other Excel plot. Contour Plot works with any contour data. It accommodates rectangular data, nearly rectangular data, and...
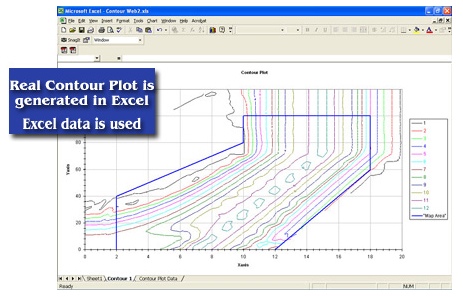
Real contour plots are created in Excel. You can interact with the contour plot just like any other Excel plot. Contour Plot works with any contour data. It accommodates rectangular data, nearly rectangular data, and irregular data. It includes a data generator for polynomials or any equation. The free trial version creates a picture. The full version creates an Excel chart.
Previous Versions
Here you can find the changelog of Contour Plot for Excel since it was posted on our website on 2015-04-25 03:00:00.
The latest version is 1.01 and it was updated on 2024-04-22 21:07:26. See below the changes in each version.
Contour Plot for Excel version 1.01
Updated At: 2012-02-21
Disclaimer
External Download
We do not host Contour Plot for Excel on our servers. We did not scan it for viruses, adware, spyware or other type of malware. This app is hosted by the software publisher and passed their terms and conditions to be listed there. We recommend caution when installing it.
The external download link for Contour Plot for Excel is provided to you by apps112.com without any warranties, representations or guarantees of any kind, so access it at your own risk.
If you have questions regarding this particular app contact the publisher directly. For questions about the functionalities of apps112.com contact us.